World Migration Report 2022
Since 2000, IOM has been producing world migration reports. The World Migration Report 2022, the eleventh in the world migration report series, has been produced to contribute to an increased understanding of migration throughout the world. This new edition presents key data and information on migration as well as thematic chapters on highly topical migration issues.
The vast majority of people continue to live in the countries in which they were born —only one in 30 are migrants.
The starting point for most migration discussions is usually numbers. Understanding scale changes, emerging trends, and shifting demographics associated with global social and economic transformations such as migration helps us make sense of the changing world we live in and plan for the future. According to current estimates, there will be approximately 281 million international migrants in the world in 2020, accounting for 3.6% of the global population.
Over the last five decades, the estimated number of international migrants has increased. In 2020, there will be 281 million people living in countries other than their birth countries, which is 128 million more than in 1990 and more than three times the estimated number in 1970.
In 2020
281 million migrants
3.60% of the population

Available data reflect an overall increase in remittances in recent decades, from $126 billion in 2000 to $702 billion in 2020. Despite predictions of a large decline in international remittances due to COVID-19, 2020 saw only a slight drop (2.4%) from the 2019 global total.
International remittances are financial or in-kind transfers made directly by migrants to families or communities in their home countries.
Despite numerous data gaps, definitional differences, and methodological challenges in compiling accurate statistics, the World Bank compiles global data on international remittances. However, because it does not capture unrecorded flows through formal or informal channels, the actual magnitude of global remittances is likely to be greater than available estimates.
In 2020, India, China, Mexico, the Philippines, and Egypt were the top five remittance recipient countries (in descending order), though India and China were far ahead of the rest, with total inward remittances exceeding $83 billion and $59 billion, respectively.
How the top ten remittance recipients have shifted since 1995
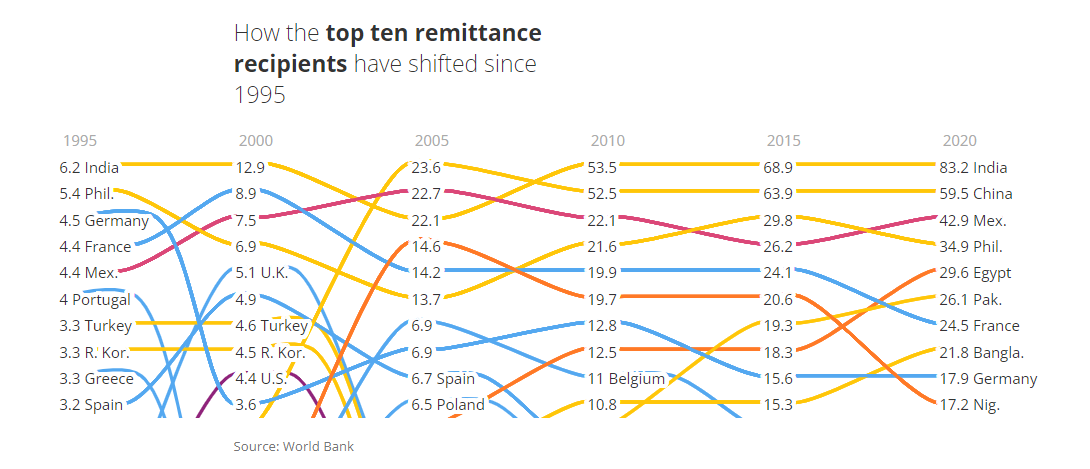
Source: World Bank
High-income countries are almost always the main source of remittances. For decades, the United States has consistently been the top remittance-sending country, with a total outflow of $68 billion in 2020, followed by the United Arab Emirates ($43.2 billion), Saudi Arabia ($34.6 billion), Switzerland ($27.96 billion), and Germany ($22 billion).
How the top ten remittance sources have shifted since 1995

Source: World Bank
COVID-19-related immobility has become the “great disrupter” of migration.
COVID-19 was the most severe pandemic in a century, with its high transmission, virus strains, and disease severity pushing policymakers into previously uncharted territory.
While the primary focus has undoubtedly been on responding to the global health crisis (e.g., virus testing, disease treatment, and vaccination development and programming), a significant part of the response has involved drastic changes to people's freedom of movement all over the world, which has massively impacted human mobility globally.
Governments around the world implemented a variety of measures to limit the virus's spread, and a variety of restrictions were implemented beginning in early 2020 and gradually evolving over time.
New data sets have emerged to track global policy responses, such as the University of Oxford Covid19 Government Response Tracker, which has recorded a wide range of global government responses, such as "stay-at-home" measures, workplace closures, school closures, restrictions on gatherings, restrictions on internal movement within a country, and international travel control measures.
Overall, the vast majority of countries around the world quickly implemented COVID-19 travel restriction measures – both internal and international – with the peak occurring in late March to early April 2020.
How many countries have restricted travel ... … compared to other measures
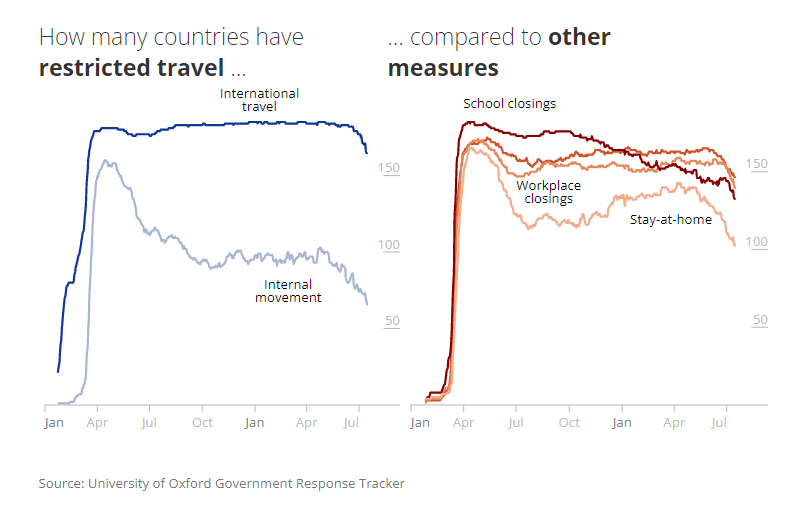
Source: University of Oxford Government Response Tracker
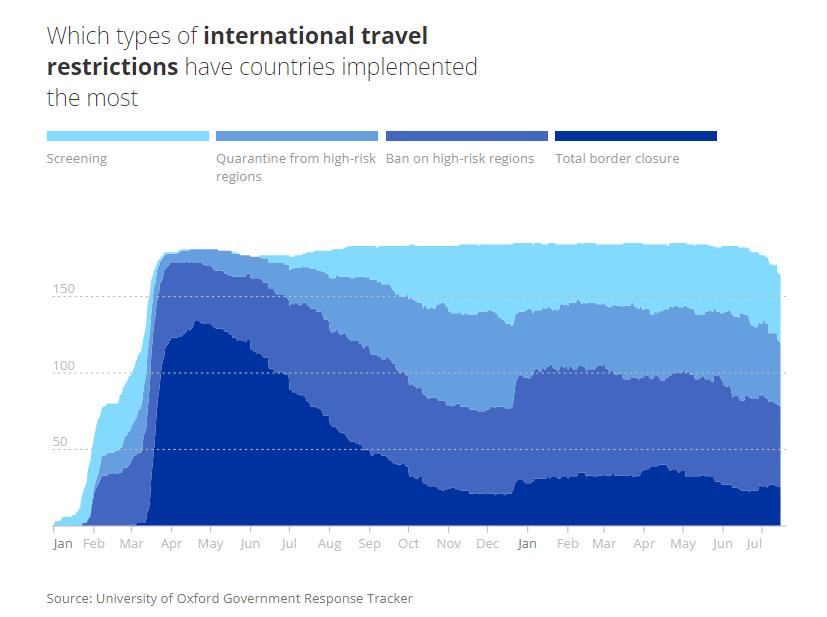
Some countries prohibited all foreign citizens from entering, while others prohibited citizens from specific countries from entering, and still others completely closed borders to prevent all people, including their own citizens, from leaving or entering. Some countries also implemented quarantine measures, requiring passengers entering a country to be quarantined in isolation for a minimum period (typically 10 to 14 days) immediately upon arrival.
Which types of international travel restrictions have countries implemented the most
Both targeted and general movement recommendations/restrictions were put in place by various countries around the world. However, while international travel restrictions of some sort remained in place in all countries globally one year after the World Health Organization’s declaration of the pandemic on 10 March 2020, internal restrictions declined over time.
Which types of internal movement restrictions have countries implemented the most
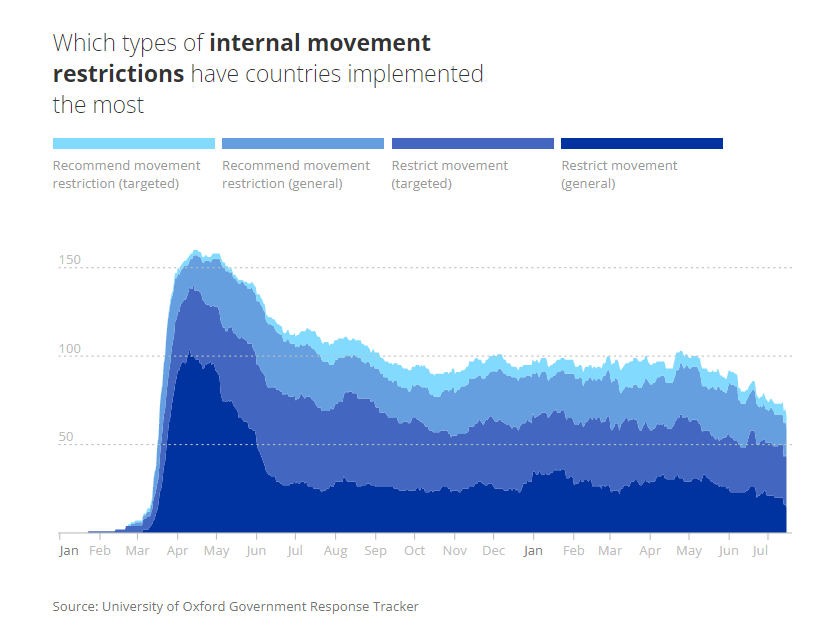
Source: University of Oxford Government Response Tracker
International travel restrictions were more likely (than internal controls) to have been enacted early in the pandemic. But there was a greater variety of control measures during the initial weeks (including screening early on), probably due to governments needing to assess the severity of the crisis during a period of extraordinary uncertainty. Moreover, measures such as total border closures, enacted by most countries in the early weeks and months of the pandemic, eased over time and by July 2021, most countries had dropped such controls.
Timeline of international travel restrictions

Source: University of Oxford Government Response Tracker
Note: The boundaries and names shown and the designations used on this map do not imply official endorsement or acceptance by the International Organization for Migration.
Measures to control internal movement between cities/regions came into force slightly later than international travel restrictions. While these measures have declined over time, a third of all countries still had internal travel restrictions in place one year after the pandemic commenced.
Timeline of internal movement restrictions
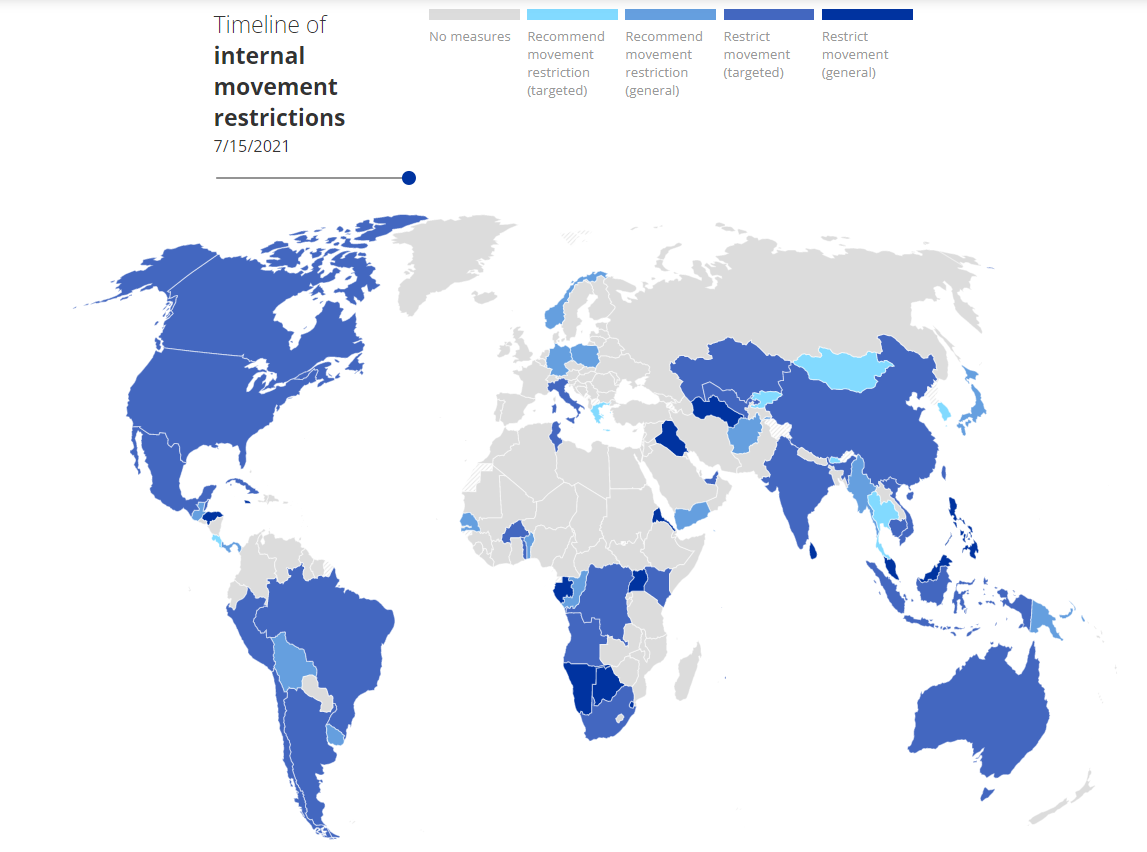
University of Oxford Government Response Tracker
Note: The boundaries and names shown and the designations used on this map do not imply official endorsement or acceptance by the International Organization for Migration.
Over time, travel/border restrictions and health-related measures have changed as the technology and logistical capacity supporting health-related measures has been developed and rolled out. Pre-travel testing, quarantine and vaccination-certificated entry being rolled out by different countries saw the travel restrictions being overtaken by health-related measures in October 2020, as shown by IOM's COVID-19 Mobility data.
If we look at country to country corridors, as travel restrictions eased … ... health-related measures surged
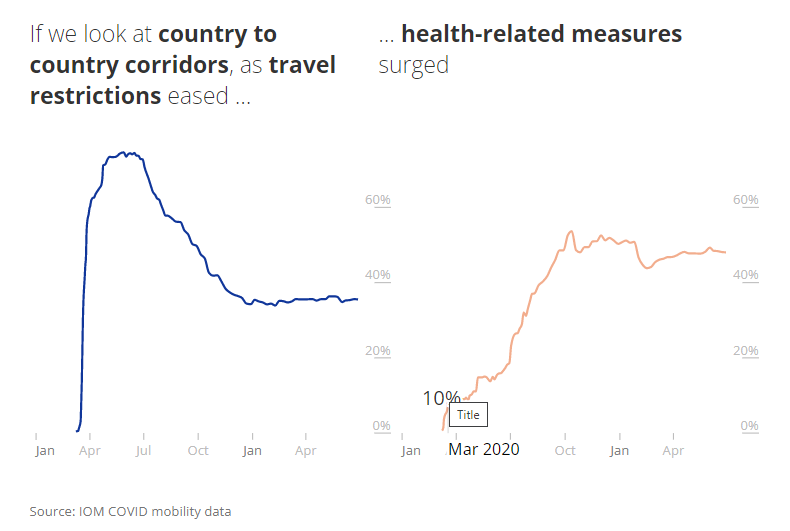
Source: IOM COVID mobility data
Notes: We use countries only, although the data captures countries, territories, and areas. Health-related measures include health screening and monitoring, testing/medical certificates, and quarantine measures. Travel restrictions include passenger restrictions based on nationality or arrival from a geographic location.
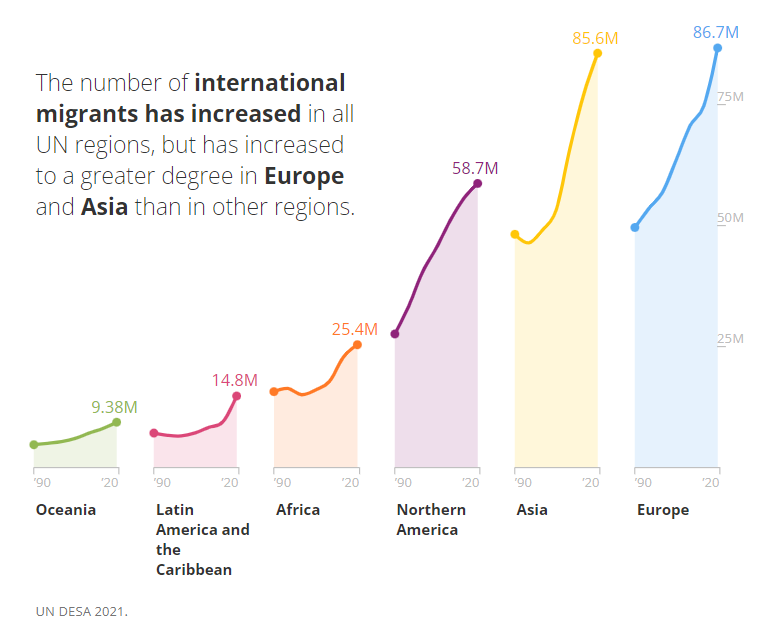
Europe and Asia each hosted around 87 and 86 million international migrants, respectively – comprising 61% of the global international migrant stock.
These regions were followed by North America, which had nearly 59 million international migrants in 2020, accounting for 21% of the global migrant stock, Africa, which had 9%, Latin America and the Caribbean, which had 5%, and Oceania, which had 3%.
When compared to the size of the population in each region, Oceania, North America, and Europe had the highest proportions of international migrants in 2020, accounting for 22%, 16%, and 12% of the total population, respectively. In comparison, the proportion of international migrants in Asia and Africa (1.8 percent and 1.9 percent, respectively) and Latin America and the Caribbean is relatively low (2.3 percent ).
However, Asia experienced the most remarkable growth from 2000 to 2020, at 74 per cent (around 37 million people in absolute terms). Europe experienced the second-largest growth during this period, with an increase of 30 million international migrants, followed by an increase of 18 million international migrants in North America and 10 million in Africa.
The number of international migrants has increased in all UN regions, but has increased to a greater degree in Europe and Asia than in other regions.
The proportion of international migrants varies significantly around the world.
The vast majority of people do not migrate across borders; instead, a much larger proportion migrate within countries (an estimated 740 million internal migrants in 2009). Nonetheless, an increase in international migrants has been observed over time – both numerically and proportionally – and at a slightly faster rate than previously predicted.
Although international migrants make up a small proportion of the global population (3.6 percent), there is wide variation at the country level. Over 88 percent of the population in some countries, such as the United Arab Emirates, are international migrants.
The map shows the total number of international migrants within each country

This interactive uses the latest international migrant stock data, published by UN DESA in January 2021, whereas the World Migration Report 2020 draws upon the latest available data at the time of publication (November 2019).
Note: The boundaries and names shown and the designations used on this map do not imply official endorsement or acceptance by the International Organization for Migration.
Multiple factors have shaped migration “corridors” over the years.
Long-term data show that international migration is not uniform throughout the world, but is shaped by economic, geographic, demographic, and other factors, resulting in distinct migration patterns, such as migration "corridors" that have developed over time.
Migration corridors are the result of the accumulation of migratory movements over time, and they provide a snapshot of how migration patterns have evolved into significant foreign-born populations in specific destination countries.